
| Tested on | Ubuntu 26.04 LTS (Resolute Raccoon) |
|---|---|
| Package | terraform 1.15.8-1graphviz 14.1.2 |
| Applies to | Any host with Terraform installed |
| Lab environment | Single Ubuntu VM with Terraform — Terraform lab environment on Ubuntu |
| Privilege | Normal user; sudo for Graphviz install |
| Scope | The terraform graph command, simplified default graphs versus operation graphs with -type, DOT output, -draw-cycles for cycle debugging, Graphviz rendering to SVG and PNG, implicit references versus explicit depends_on in the graph, a small child module example, troubleshooting uses, and limitations. Does not teach Graphviz syntax, graph theory, or duplicate the full dependency tutorial in the resource dependencies lesson. |
| Related guides | Terraform modules terraform plan command Terraform troubleshooting Terraform Associate certification course |
When a configuration grows past a handful of resources, it gets harder to see why Terraform waits on one object before touching another. The terraform graph command prints the dependency relationships Terraform uses internally as DOT text you can read in the terminal or pipe through Graphviz into SVG or PNG images.
This lesson is an Advanced / Professional topic in the Terraform track. It complements Terraform resource dependencies, which explains how references and depends_on create those edges. Here the focus is generating the graph, rendering it, and using it while debugging.
You do not need browser screenshots or the HCP Terraform UI for this article. The visuals are the DOT transcript and the rendered graph files you create locally.
Work in ~/terraform-labs/terraform-graph/ on the Terraform lab environment on Ubuntu.
What does terraform graph show?
By default, terraform graph produces a simplified directed graph showing dependency ordering between resource and data blocks in the configuration. Resources inside child modules retain their module addresses and may appear grouped by module in the DOT output. Terraform can also expose more detailed operation graphs with -type=plan, -type=apply, and related options.
Each node in the default graph is a resource or data address Terraform knows about. Each arrow is a dependency edge: the tail depends on the head, so Terraform will not complete the tail until the head is satisfied for the operation at hand.
Those edges come from the same sources described in the dependencies lesson:
attribute references  ──┐
depends_on meta-arg   ──┼──►  dependency graph  ──►  terraform graph (DOT)
module calls          ──┘
A reference such as terraform_data.network.output creates an implicit edge because the downstream block needs a value from the upstream block. depends_on adds an explicit edge when ordering is required but no attribute should be passed. Module calls introduce nested nodes, often grouped in a subgraph cluster per module.
The graph is a structural view of constraints Terraform recorded. It is not a promise that every arrow maps to identical runtime behavior on every apply, and it is not a substitute for an architecture diagram you would present to stakeholders.
Create a configuration with dependencies
Start in the implicit lab directory with two terraform_data resources where the application tier references the network tier:
resource "terraform_data" "network" {
  input = "network-ready"
}

resource "terraform_data" "application" {
  input = terraform_data.network.output
}

output "app" {
  value = terraform_data.application.output
}
Create the directory and write the file:
mkdir -p ~/terraform-labs/terraform-graph/implicit && cd ~/terraform-labs/terraform-graph/implicitSave the configuration above as main.tf, then initialize Terraform:
terraform initSample output:
Initializing the backend...

Initializing provider plugins...
- terraform.io/builtin/terraform is built in to Terraform

Terraform has been successfully initialized!
Generate DOT output with terraform graph
After init, ask Terraform to print the graph:
terraform graphSample output:
digraph G {
  rankdir = "RL";
  node [shape = rect, fontname = "sans-serif"];
  "terraform_data.application" [label="terraform_data.application"];
  "terraform_data.network" [label="terraform_data.network"];
  "terraform_data.application" -> "terraform_data.network";
}
The digraph G line opens a DOT directed graph. rankdir = "RL" lays nodes right-to-left. The quoted strings are Terraform resource addresses. The line "terraform_data.application" -> "terraform_data.network" is the dependency edge: application depends on network.
You do not need to memorize DOT syntax. For small labs, searching the output for -> is enough to confirm which resource points at which upstream object.
Render Terraform graphs with Graphviz
DOT text is useful in the terminal, but wide configurations are easier to scan as images. Rendering requires the Graphviz dot program on your workstation.
Install Graphviz on Ubuntu
Install Graphviz once on the lab VM:
sudo apt install -y graphvizConfirm the version:
dot -VSample output:
dot - graphviz version 14.1.2 (0)That is the entire Graphviz setup this article needs. Layout tuning and DOT attribute syntax are out of scope.
Render SVG and PNG
From a directory that already ran terraform init, pipe the default graph into dot and write an SVG file:
terraform graph | dot -Tsvg > terraform-graph.svgYou can also produce a PNG when you need a raster image for slides or tickets:
terraform graph | dot -Tpng > terraform-graph.pngConfirm the files Terraform and Graphviz created:
file terraform-graph.svgSample output:
terraform-graph.svg: SVG XML documentThe PNG file should report raster image metadata:
file terraform-graph.pngSample output:
terraform-graph.png: PNG image data, 543 x 59, 8-bit/color RGBA, non-interlacedThe implicit two-node graph is small enough to read as text, but the rendered version matches what you would skim in a larger configuration:

Compare implicit and explicit dependencies in the graph
An implicit dependency from terraform_data.network.output already produced the edge above. Next, remove that reference and declare ordering with depends_on only.
Create a fresh directory for the explicit-only example:
mkdir -p ~/terraform-labs/terraform-graph/explicitWrite the following into explicit/main.tf:
resource "terraform_data" "network" {
  input = "network-ready"
}

resource "terraform_data" "application" {
  input = "application"

  depends_on = [
    terraform_data.network
  ]
}
Change into the directory and initialize Terraform:
cd ~/terraform-labs/terraform-graph/explicit && terraform initPrint only the graph lines that mention the two resources:
terraform graph | grep -E 'network|application'Sample output:
  "terraform_data.application" [label="terraform_data.application"];
  "terraform_data.network" [label="terraform_data.network"];
  "terraform_data.application" -> "terraform_data.network";
The arrow is the same shape as in the implicit directory. Both references and depends_on create graph edges; a reference also documents data flow, which depends_on alone does not.
To see what changes when no dependency exists, use two independent resources with neither references nor depends_on:
mkdir -p ~/terraform-labs/terraform-graph/no-depsSave this configuration as no-deps/main.tf:
resource "terraform_data" "alpha" {
  input = "alpha"
}

resource "terraform_data" "beta" {
  input = "beta"
}
Change into the directory and initialize Terraform:
cd ~/terraform-labs/terraform-graph/no-deps && terraform initWith no references connecting the two blocks, the graph should list both nodes and no edge between them:
terraform graphSample output:
digraph G {
  rankdir = "RL";
  node [shape = rect, fontname = "sans-serif"];
  "terraform_data.alpha" [label="terraform_data.alpha"];
  "terraform_data.beta" [label="terraform_data.beta"];
}
Two nodes, no -> line between them. Adding either a reference or depends_on is what introduces the edge. For when to choose each style, stay with the Terraform resource dependencies lesson rather than repeating that decision tree here.
Graph a module configuration
Real configurations add module clusters, which makes graphs wider but follows the same rules. Create the module lab layout first:
mkdir -p ~/terraform-labs/terraform-graph/module/modules/stackSave the root configuration as module/main.tf:
resource "terraform_data" "foundation" {
  input = "base"
}

module "stack" {
  source = "./modules/stack"
  seed   = terraform_data.foundation.output
}

output "result" {
  value = module.stack.value
}
Save the child module as module/modules/stack/main.tf:
variable "seed" {
  type = string
}

resource "terraform_data" "inner" {
  input = var.seed
}

output "value" {
  value = terraform_data.inner.output
}
Change into the root module directory and initialize:
cd ~/terraform-labs/terraform-graph/module && terraform initInspect the graph Terraform built for the module call:
terraform graphSample output, trimmed:
digraph G {
  rankdir = "RL";
  node [shape = rect, fontname = "sans-serif"];
  "terraform_data.foundation" [label="terraform_data.foundation"];
  subgraph "cluster_module.stack" {
    label = "module.stack"
    fontname = "sans-serif"
    "module.stack.terraform_data.inner" [label="terraform_data.inner"];
  }
  "module.stack.terraform_data.inner" -> "terraform_data.foundation";
}
The subgraph "cluster_module.stack" block is Graphviz grouping for the module. The edge from module.stack.terraform_data.inner to terraform_data.foundation is the implicit dependency created by passing terraform_data.foundation.output into seed.
Render when the text graph is hard to scan:
terraform graph | dot -Tsvg > module-graph.svg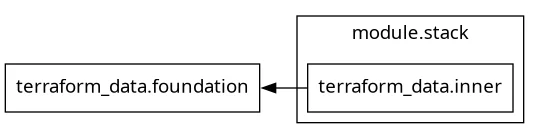
Large estates produce dense graphs. Use terraform graph for focused debugging — one module, one environment, one suspected cycle — rather than as permanent architecture documentation.
Use terraform graph for troubleshooting
Reach for the graph when ordering surprises you during plan or apply:
- Unexpected dependency — a resource waits on something you did not intend; search the DOT for
->lines touching that address. - Cycle investigation — use an operation graph with
-type=planand-draw-cycles; see the subsection below. - Module relationships — confirm whether a child module resource waits on a root-module object or only on addresses inside the module.
- Why an operation waits — the graph explains constraint edges, not provider latency; it still answers whether Terraform believes object B must finish before object A.
Inspect plan graphs and dependency cycles
The default terraform graph output is intentionally simplified. When you need the graph Terraform builds for a planning operation, use:
terraform graph -type=planSample output from the implicit lab directory, trimmed:
digraph {
  subgraph "root" {
    "[root] provider[\"terraform.io/builtin/terraform\"]" [label = "provider[\"terraform.io/builtin/terraform\"]", shape = "diamond"]
    "[root] terraform_data.application (expand)" [label = "terraform_data.application", shape = "box"]
    "[root] terraform_data.network (expand)" [label = "terraform_data.network", shape = "box"]
    "[root] terraform_data.application (expand)" -> "[root] terraform_data.network (expand)"
Operation graphs expose more implementation-level nodes than the default resource-oriented graph, including provider configuration and expansion steps. They are more useful for focused troubleshooting than for general documentation.
If terraform validate or terraform plan reports Error: Cycle, add -draw-cycles. The flag works only with an operation graph type such as plan, apply, plan-destroy, or plan-refresh-only. The Terraform resource dependencies lesson explains how mutual references create cycles; reproduce the graph in this article's own cycle directory:
mkdir -p ~/terraform-labs/terraform-graph/cycleSave this configuration as cycle/main.tf:
resource "terraform_data" "a" {
  input = terraform_data.b.output
}

resource "terraform_data" "b" {
  input = terraform_data.a.output
}
Change into the directory and initialize Terraform:
cd ~/terraform-labs/terraform-graph/cycle && terraform initInspect the highlighted cycle edges in DOT before rendering:
terraform graph -type=plan -draw-cycles | grep -E 'color = "red"|terraform_data\.(a|b)'Sample output, trimmed to the loop:
"[root] terraform_data.a (expand)" -> "[root] terraform_data.b (expand)" [color = "red", penwidth = "2.0"]
"[root] terraform_data.b (expand)" -> "[root] terraform_data.a (expand)" [color = "red", penwidth = "2.0"]
Terraform marks those edges in red so Graphviz can emphasize the loop. Pipe the same graph into dot and save an SVG:
terraform graph -type=plan -draw-cycles | dot -Tsvg > cycle-graph.svgConfirm Graphviz wrote the file:
file cycle-graph.svgSample output:
cycle-graph.svg: SVG XML documentFix the dependency in HCL and regenerate the graph; never edit the DOT output as a solution.
The graph alone will not explain every apply ordering detail. Provider logic, -target, lifecycle rules, and parallelism between unrelated branches all affect what you observe at runtime. Treat the graph as evidence of declared dependencies, then change configuration rather than the rendered image.
Common graph problems
| Symptom | Likely cause | Fix |
|---|---|---|
dot: command not found |
Graphviz not installed | sudo apt install graphviz on Ubuntu |
terraform graph fails before printing DOT |
Directory not initialized | Run terraform init in the configuration root |
| Rendered image is an unreadable hairball | Too many nodes for one diagram | Narrow scope, grep for one resource address, or debug one module at a time |
| Graph order does not match file order | Misconception that .tf file order drives apply |
Dependencies come from references and depends_on, not filenames |
| Edited SVG but plan unchanged | DOT is output-only | Change HCL, then regenerate with terraform graph |
| Expected edge missing | No reference or depends_on between instances |
Add the relationship in configuration; see the dependencies lesson |
Clean up the lab
The graph command does not create managed infrastructure when you only run terraform graph and rendering. If you applied any of the lab directories during experiments, destroy them. Remove the lab tree when you are finished:
rm -rf ~/terraform-labs/terraform-graphReferences
Summary
terraform graph turns Terraform's internal dependency model into DOT text you can read or render. On the implicit lab configuration, a single arrow showed terraform_data.application depending on terraform_data.network because of an attribute reference. Installing Graphviz under Render Terraform graphs with Graphviz and piping through dot -Tsvg or dot -Tpng produced image files you verified with file.
Explicit depends_on created the same edge when no attribute reference was present, while two independent resources produced nodes with no arrow between them. The module example added a cluster_module.stack subgraph and an edge from the child module resource back to terraform_data.foundation, which is the pattern you will see when debugging module input wiring.
Use the default graph for quick resource-order checks. When troubleshooting gets harder, terraform graph -type=plan exposes the planning graph with provider and expansion nodes, and terraform graph -type=plan -draw-cycles highlights cycle edges in red before you render with Graphviz. Remember the default graph is simplified on purpose, and editing DOT or SVG does not fix configuration. For why references and depends_on create edges, continue with Terraform resource dependencies.
Frequently Asked Questions
What format does terraform graph output?
terraform graph prints a dependency graph in DOT format, which Graphviz tools such as dot can render into SVG, PNG, or PDF. The text is readable on its own for small configurations, but rendering makes dense graphs easier to scan.
Do I need Graphviz to use terraform graph?
No. terraform graph itself only prints DOT text to stdout. Graphviz is optional and is used when you want a rendered image file from that DOT output.
What is the difference between terraform graph and terraform graph -type=plan?
The default output is a simplified resources-only dependency graph. -type=plan exposes the more detailed graph Terraform uses for a planning operation, including implementation-level nodes normally hidden from the simplified view. HashiCorp warns that operation graph types expose more Terraform runtime implementation details than the default graph.
Does every arrow in the graph mean two resources always run one after the other?
An arrow means Terraform recorded a dependency edge between instances. Independent branches without an edge between them may still run in parallel during apply. The graph shows ordering constraints, not a literal second-by-second execution timeline.
Can I fix dependency problems by editing the DOT file?
No. The DOT output is generated from your configuration and state metadata. Change references, depends_on, or module structure in HCL, then regenerate the graph.
Why is my rendered graph unreadable?
Large configurations produce wide graphs with many nodes. Filter with grep, render only the subgraph you care about, or use the graph to answer a focused question such as whether module.stack waits on foundation rather than trying to diagram the entire estate at once.
