
Free Online Course · Self-paced

Pandas Tutorial for Data Analysis (with examples)

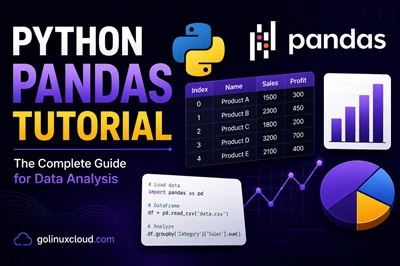
Free, hands-on Pandas tutorial - DataFrame fundamentals, reading and writing CSVs, selecting, filtering, joining, grouping, reshaping, and visualizing data. 30+ examples tested on Python 3.11 + pandas 2.x.

  • 37 parts
  • ~362 min total
  • Beginner to Intermediate
  • Updated Aug 2026
Pandas Tutorial for Data Analysis (with examples)
By Last updated

Pandas is the de-facto standard for working with tabular data in Python - and once you internalize its model (DataFrame = labeled 2D table, Series = labeled 1D array), 90% of your "wait, how do I do X in Pandas?" questions disappear. This tutorial gives you that mental model first, then walks through every operation you will actually hit in real data work.

We cover reading and writing data (CSV, SQL, Excel), selecting rows and columns, cleaning and converting types, combining DataFrames (concat / merge / join), grouping and reshaping (groupby / pivot / melt), and visualization. Every example uses real-looking data instead of toy [1, 2, 3] rows, and every snippet is tested on pandas 2.x.

Click Start the course to begin with the Pandas concepts chapter, or jump to the chapter you need - Selecting Rows and Columns and Combining DataFrames are the most-bookmarked.


How to use this course

Open a Jupyter notebook or IPython session beside each lesson. Load the sample CSV or SQL extract provided in the article, run the snippet, and inspect df.head() after every transformation so you can see dtype changes before they surprise you in production. The first chapters establish Series vs DataFrame mental models; middle chapters cover selection, cleaning, and merges; closing chapters handle time series, rolling windows, and plotting.

If a method accepts many parameters (read_csv, merge, groupby), the lesson shows the two or three arguments you will use daily and links to the pandas documentation for the rest.


What to install

Package Purpose
Python 3.10+ Matches pandas 2.x wheels on Linux and macOS
pandas 2.x Core tutorial runtime
JupyterLab or notebook Interactive exploration
Optional: SQLAlchemy + DB driver Database read/write chapters
Optional: matplotlib Histogram and plot examples

Create a virtual environment with python -m venv .venv before installing packages. For broader Python syntax and virtualenv workflow, see the Python tutorial hub.


Skills by chapter group

Group Typical tasks
IO CSV, Excel, SQL, parquet-style exports
Selection loc/iloc, boolean masks, multi-index columns
Cleaning Missing values, type coercion, string ops
Combine concat, merge, join, reshaping with pivot
Analyze groupby, aggregations, resample, rolling stats
Present Histograms and quick plots for sanity checks

After tabular workflows feel natural, continue with the Python tutorial for broader data tooling or export clean DataFrames to BI tools from the SQL integration lessons.

What you'll learn

  • Create, inspect, and manipulate Pandas DataFrames and Series
  • Read and write CSV, JSON, Excel, and SQL data
  • Select, filter, and transform columns with loc / iloc / boolean masks
  • Combine DataFrames with concat, merge, join, and append
  • Aggregate with groupby, pivot, melt, and reshape data for analysis
  • Handle missing values, datetimes, and produce simple visualizations

Prerequisites

  • Python 3.10+ installed locally
  • Basic Python syntax (variables, lists, dicts, functions, list comprehensions)
  • pandas 2.x and numpy installed (pip install pandas numpy)

Syllabus

11 chapters · 37 lessons · ~362 min of reading

  1. 1 Pandas Concepts (start here if new) 2 lessons
    1. Part 1 Introduction to Python Pandas 11 min read
    2. Part 2 The Pandas DataFrame explained 16 min read
  2. 2 Reading and Writing Data 4 lessons
    1. Part 3 Read CSV files with pandas 12 min read
    2. Part 4 Write a DataFrame to CSV 14 min read
    3. Part 5 Export a DataFrame to SQL 10 min read
    4. Part 6 Print the entire DataFrame (no truncation) 13 min read
  3. 3 Inspecting and Sizing DataFrames 3 lessons
    1. Part 7 Count rows in a DataFrame 7 min read
    2. Part 8 Get the size and shape of a DataFrame 9 min read
    3. Part 9 Get unique values from a column 4 min read
  4. 4 Selecting Rows and Columns 5 lessons
    1. Part 10 loc vs iloc vs at vs iat - the difference 6 min read
    2. Part 11 Select by integer position with iloc 12 min read
    3. Part 12 Select a single column 6 min read
    4. Part 13 Select multiple columns 7 min read
    5. Part 14 Filter rows by column value 11 min read
  5. 5 Adding and Modifying Columns / Rows 5 lessons
    1. Part 15 Add a new column to a DataFrame 6 min read
    2. Part 16 Add an empty column 13 min read
    3. Part 17 Add a row to a DataFrame 7 min read
    4. Part 18 Rename one or more columns 16 min read
    5. Part 19 Change the order of columns Coming soon
  6. 6 Cleaning and Type Conversion 6 lessons
    1. Part 19 Convert a column to int 6 min read
    2. Part 20 Convert a column to float 11 min read
    3. Part 21 Convert strings to datetime 15 min read
    4. Part 22 Drop missing values with dropna() 14 min read
    5. Part 23 Drop rows by condition 8 min read
    6. Part 24 Drop columns from a DataFrame 5 min read
  7. 7 Indexing 2 lessons
    1. Part 25 Set a column as the index 9 min read
    2. Part 26 Reset the DataFrame index 6 min read
  8. 8 Combining DataFrames 3 lessons
    1. Part 27 Concatenate DataFrames with concat() 18 min read
    2. Part 28 merge vs concat vs append vs join 13 min read
    3. Part 29 Build a DataFrame from a list of dictionaries 6 min read
  9. 9 Aggregation and Reshaping 5 lessons
    1. Part 30 Group and aggregate with groupby() 16 min read
    2. Part 31 Pivot tables in pandas 15 min read
    3. Part 32 Reshape with melt() 4 min read
    4. Part 33 Resample time-series data 11 min read
    5. Part 34 Rolling window calculations 6 min read
  10. 10 Iteration and Mapping 2 lessons
    1. Part 35 Iterate over DataFrame rows 9 min read
    2. Part 36 Apply a function with Series.map() 4 min read
  11. 11 Visualization 1 lesson
    1. Part 37 Create histograms from a DataFrame 6 min read
Deepak Prasad

R&D Engineer

Founder of GoLinuxCloud with more than 15 years of expertise in Linux, Python, Go, Laravel, DevOps, Kubernetes, Git, Shell scripting, OpenShift, AWS, Networking, and Security. With extensive experience, he excels across development, DevOps, networking, and security, delivering robust and efficient solutions for diverse projects.

  • Go (programming language)
  • Python (programming language)
  • DevOps
  • Computer Security
  • Cloud Computing
  • Kubernetes
  • Linux
  • Ansible (software)
