
Create histogram with pandas hist() function
By using hist() function, we can create a histogram through pandas. A
histogram is a representation of the distribution of data. This function
calls<span class="pre">matplotlib.pyplot.hist()</span>, on each
series in the DataFrame, resulting in one histogram per column.
Syntax:
DataFrame.hist(column=None, by=None, xlabelsize=None, ylabelsize=None, figsize=None, layout=None, bins=n, color=None)Parameters
- **data -**It refers to the input pandas DataFrame
- column - It refers to the input pandas DataFrame column, where we can get histogram on this column.
- **by -**It will refers to the histogram to form the separate groups
- xlabelsize - It refers to size of histogram on x - axis
- **ylabelsize -**It refers to size of histogram on y - axis
- figsize - It represents the size of histogram
- layout - It refers to rows/columns layout.
- bins - It refers to the number of bins to the histogram needed
- color - histogram color (default is blue)
Different methods to create and customize histogram in Pandas
- Create Histogram from single column in a dataframe
- Create Histogram from entire dataframe
- Create Histogram with specific size
- Create Histogram with number of bins
- Create Histogram with specific color
Create pandas DataFrame with example data
DataFrame is a data structure used to store the data in two dimensional format. It is similar to table that stores the data in rows and columns. Rows represents the records/ tuples and columns refers to the attributes.
We can create the DataFrame by using**pandas.DataFrame()**method.
Syntax:
pandas.DataFrame(input_data,columns,index)Parameters:
It will take mainly three parameters
- input_data is represents a list of data
columnsrepresent the columns names for the dataindexrepresent the row numbers/values
We can also create a DataFrame using dictionary by skipping columns and indices.
Example:Python Program to create a dataframe for market data from a dictionary of food items by specifying the column names.
# import pandas
import pandas

# create dataframe with college data
dataframe = pandas.DataFrame({'Name': {0: 'sravan', 1: 'bobby', 2: 'deepak',3:'prasad'},
                'Subjects': {0: 'PHP', 1: 'PHP', 2: 'dbms',3:'java'},
                'Marks': {0: 89, 1: 90, 2: 93,3:57}})

# display dataframe
print(dataframe)Output:
Name Subjects  Marks
0  sravan      PHP     89
1   bobby      PHP     90
2  deepak     dbms     93
3  prasad     java     57
Method 1 : Create Histogram from single column in a dataframe
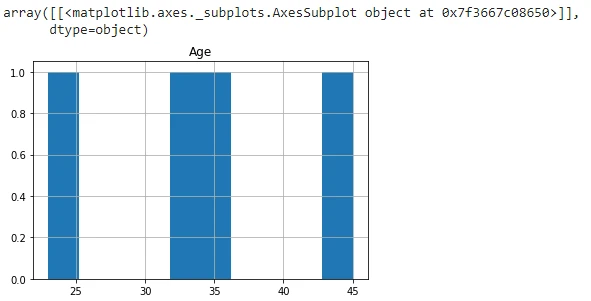
Example 1:In this example, we are creating a histogram from Age column with out specifying any parameters.
# import pandas
import pandas

# create dataframe with college data
dataframe = pandas.DataFrame({'Name': {0: 'sravan', 1: 'bobby', 2: 'deepak',3:'prasad'},
                'Subjects': {0: 'PHP', 1: 'PHP', 2: 'dbms',3:'java'},
                'Marks': {0: 89, 1: 90, 2: 93,3:57},
        'Age':{0:23,1:45,2:32,3:34}})

# create histogram
dataframe.hist('Age')Output:
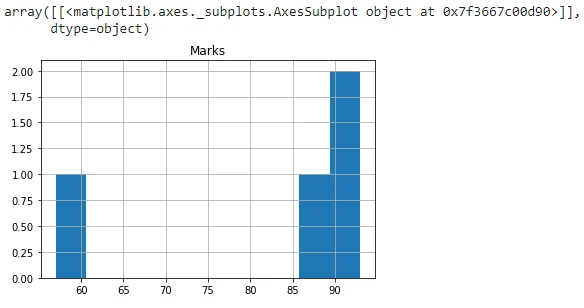
Example 2: In this example, we are creating a histogram from Marks column with out specifying any parameters.
# import pandas
import pandas

# create dataframe with college data
dataframe = pandas.DataFrame({'Name': {0: 'sravan', 1: 'bobby', 2: 'deepak',3:'prasad'},
                'Subjects': {0: 'PHP', 1: 'PHP', 2: 'dbms',3:'java'},
                'Marks': {0: 89, 1: 90, 2: 93,3:57},
        'Age':{0:23,1:45,2:32,3:34}})

# create histogram
dataframe.hist('Marks')Output:
Method 2 : Create Histogram from entire dataframe
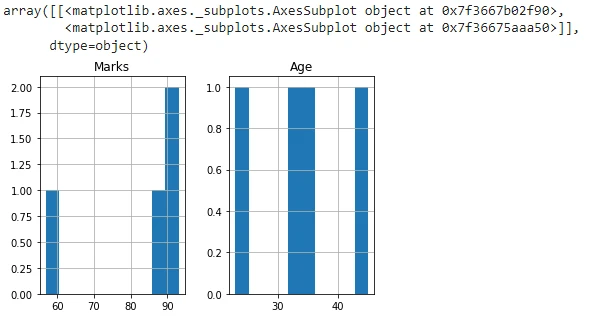
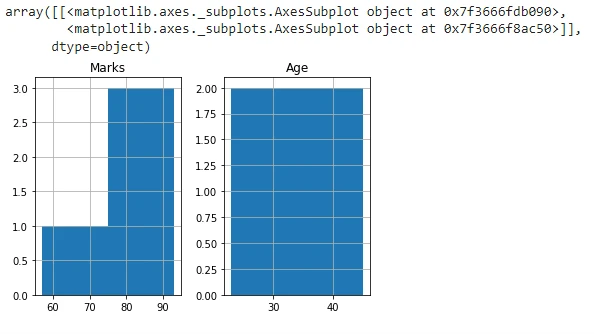
Example:In this example, we are creating a histogram from the entire dataframe and not specifying any parameters.
# import pandas
import pandas

# create dataframe with college data
dataframe = pandas.DataFrame({'Name': {0: 'sravan', 1: 'bobby', 2: 'deepak',3:'prasad'},
                'Subjects': {0: 'PHP', 1: 'PHP', 2: 'dbms',3:'java'},
                'Marks': {0: 89, 1: 90, 2: 93,3:57},
        'Age':{0:23,1:45,2:32,3:34}})

# create histogram
dataframe.hist()Output:
Method 3 : Create Histogram with specific size
Example : In this example, we are creating a histogram from Age column with x and y labelsize parameters. we are setting 11 for x and 4 for ylabelsize.
# import pandas
import pandas

# create dataframe with college data
dataframe = pandas.DataFrame({'Name': {0: 'sravan', 1: 'bobby', 2: 'deepak',3:'prasad'},
                'Subjects': {0: 'PHP', 1: 'PHP', 2: 'dbms',3:'java'},
                'Marks': {0: 89, 1: 90, 2: 93,3:57},
        'Age':{0:23,1:45,2:32,3:34}})

# create histogram
dataframe.hist('Age',xlabelsize=11,ylabelsize=4)Output:
Method 4 : Create Histogram with number of bins
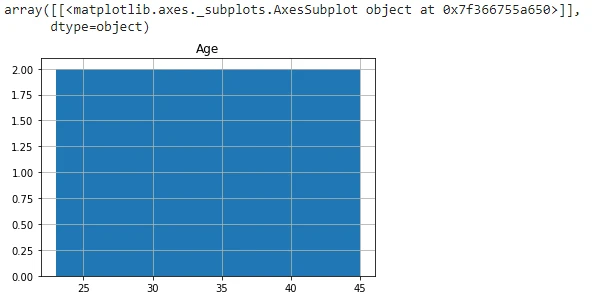
Example 1: In this example, we are creating a histogram from Age column with bins parameter, we are setting 2 as bin value , which refers to the number of bins.
# import pandas
import pandas

# create dataframe with college data
dataframe = pandas.DataFrame({'Name': {0: 'sravan', 1: 'bobby', 2: 'deepak',3:'prasad'},
                'Subjects': {0: 'PHP', 1: 'PHP', 2: 'dbms',3:'java'},
                'Marks': {0: 89, 1: 90, 2: 93,3:57},
        'Age':{0:23,1:45,2:32,3:34}})

# create histogram
dataframe.hist('Age',bins=2)Output:
Example 2: In this example, we are creating a histogram from entire dataframe with bins parameter, we are setting 2 as bin value , which refers to the number of bins.
# import pandas
import pandas

# create dataframe with college data
dataframe = pandas.DataFrame({'Name': {0: 'sravan', 1: 'bobby', 2: 'deepak',3:'prasad'},
                'Subjects': {0: 'PHP', 1: 'PHP', 2: 'dbms',3:'java'},
                'Marks': {0: 89, 1: 90, 2: 93,3:57},
        'Age':{0:23,1:45,2:32,3:34}})

# create histogram
dataframe.hist(bins=2)Output:
Method 5 : Create Histogram with specific color
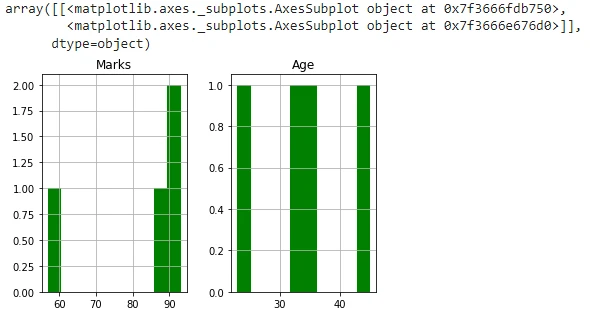
Example 1: In this example, we are creating a histogram from the entire dataframe and adding green color to the created histogram
# import pandas
import pandas

# create dataframe with college data
dataframe = pandas.DataFrame({'Name': {0: 'sravan', 1: 'bobby', 2: 'deepak',3:'prasad'},
                'Subjects': {0: 'PHP', 1: 'PHP', 2: 'dbms',3:'java'},
                'Marks': {0: 89, 1: 90, 2: 93,3:57},
        'Age':{0:23,1:45,2:32,3:34}})

# create histogram
dataframe.hist(color="green")
Output:
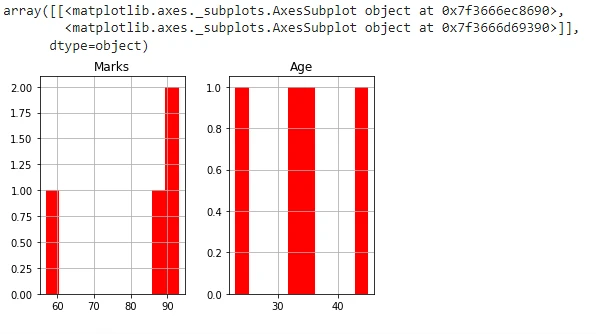
Example 2: In this example, we are creating a histogram from the entire dataframe and adding red color to the created histogram
# import pandas
import pandas

# create dataframe with college data
dataframe = pandas.DataFrame({'Name': {0: 'sravan', 1: 'bobby', 2: 'deepak',3:'prasad'},
                'Subjects': {0: 'PHP', 1: 'PHP', 2: 'dbms',3:'java'},
                'Marks': {0: 89, 1: 90, 2: 93,3:57},
        'Age':{0:23,1:45,2:32,3:34}})

# create histogram
dataframe.hist(color="red")Output:
Some more Examples
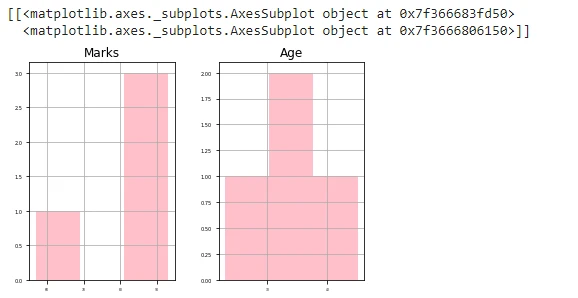
Example-1: In this example, we are creating histogram from the entire dataframe by specifying x and y labelsizes as 3 and 5 along with 5 bins and set the histogram color to pink.
# import pandas
import pandas

# create dataframe with college data
dataframe = pandas.DataFrame({'Name': {0: 'sravan', 1: 'bobby', 2: 'deepak',3:'prasad'},
                'Subjects': {0: 'PHP', 1: 'PHP', 2: 'dbms',3:'java'},
                'Marks': {0: 89, 1: 90, 2: 93,3:57},
        'Age':{0:23,1:45,2:32,3:34}})

# create histogram
print(dataframe.hist(color="pink",bins=3,xlabelsize=3,ylabelsize=5))
Output:
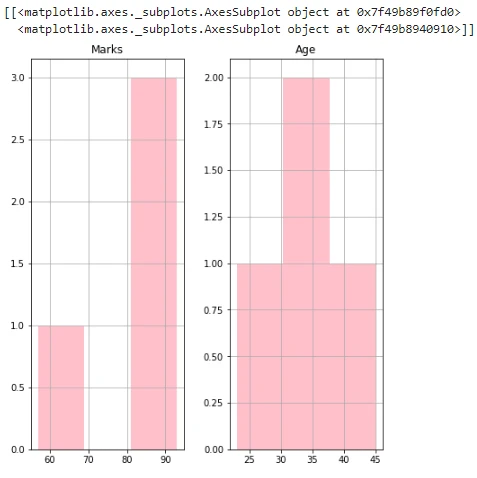
Example-2: In this example, we are creating histogram from the entire dataframe by specifying figsize as (7,8) along with 5 bins and set the histogram color to pink.
# import pandas
import pandas

# create dataframe with college data
dataframe = pandas.DataFrame({'Name': {0: 'sravan', 1: 'bobby', 2: 'deepak',3:'prasad'},
                'Subjects': {0: 'PHP', 1: 'PHP', 2: 'dbms',3:'java'},
                'Marks': {0: 89, 1: 90, 2: 93,3:57},
        'Age':{0:23,1:45,2:32,3:34}})

# create histogram
print(dataframe.hist(color="pink",bins=3,figsize=(7,8)))Output:
Summary
In data visualization , Histogram plays an important role for visualizing the data, And the attraction comes from the histogram itself. In this topic, we discussed how to create a histogram in pandas . we seen all the parameters which are required for the creation of histogram.
To summarise, we learned to create histogram in Pandas with following parameters:
- With specific size
- With number of bins
- Histogram with specific color
- With figsize