| Tested on | RHEL 10.2 (Coughlan) |
|---|---|
| Package | prometheus 3.14.0grafana 13.2.0-1 |
| Applies to | RHEL, Rocky Linux, AlmaLinux, Oracle Linux, CentOS Stream, Fedora |
| Privilege | sudo or root |
| Scope | Install Prometheus from the upstream tarball and Grafana from the official RPM repository on one RHEL-family server, enable systemd services, open firewalld when it is active, and connect Grafana to Prometheus. Does not cover Kubernetes ServiceMonitor installs, Alertmanager clustering, or TLS reverse proxies. |
| Related guides | Install Zabbix on Rocky Linux 8 Application performance monitoring tools Install ELK stack on Rocky Linux 8 Linux commands |
Prometheus collects time-series metrics and stores them locally. Grafana queries those metrics and turns them into dashboards and alerts. On RHEL, Rocky Linux, AlmaLinux, and other Enterprise Linux rebuilds, the usual pattern is an upstream Prometheus binary plus the Grafana OSS RPM from Grafana Labs—both on one host for a small lab or proof of concept.
This guide walks through that stack end to end: create a dedicated prometheus user, install Prometheus 3.x from GitHub releases, register a systemd unit, add the Grafana repository with dnf, wire Grafana to http://localhost:9090, and verify both UIs. Debian and Ubuntu use different package paths; see Install Grafana on Ubuntu when your target is apt-based.
Before you enable Prometheus, confirm port 9090 is free—the ss command shows listeners and the process bound to each port.
ss -tlnp | grep 9090 before enabling Prometheus. If Cockpit owns the port, stop cockpit.socket, change the Cockpit listen port, or pick another Prometheus listen address.
Prerequisites
- RHEL, Rocky Linux, AlmaLinux, Oracle Linux, CentOS Stream, or Fedora with outbound HTTPS to
github.com,rpm.grafana.com, and your distribution mirrors. - x86_64 (AMD64) host—the GitHub download steps below use the
linux-amd64tarball. ARM64 and other Linux builds are published separately on the Prometheus releases page. - sudo or root access for user creation,
/usr/local/bininstalls, andsystemdunits. - Port 9090 free for Prometheus and port 3000 free for Grafana before you start either service.
firewalldenabled only on hosts where you intend to open 9090/tcp and 3000/tcp to remote browsers; skip the firewall section on isolated lab VMs with no active firewall.
Confirm the OS release before you begin:
cat /etc/os-release | grep -E '^(NAME|VERSION_ID|PRETTY_NAME)='NAME="Red Hat Enterprise Linux"
VERSION_ID="10.2"
PRETTY_NAME="Red Hat Enterprise Linux 10.2 (Coughlan)"The PRETTY_NAME line confirms you are on an EL 10.x host where dnf and firewalld match this walkthrough.
Install Prometheus from the upstream binary
Prometheus ships as a single tarball on GitHub. The steps below install the server and promtool under /usr/local/bin, keep configuration in /etc/prometheus, and store TSDB data in /var/lib/prometheus.
Create the Prometheus system user
Prometheus should not run as root. A dedicated system account keeps file ownership clear:
sudo groupadd --system prometheusCreate the unprivileged service account that owns the Prometheus files:
sudo useradd -s /sbin/nologin --system -g prometheus prometheusNeither command prints output when the group and user are created successfully.
Create configuration and data directories
Prometheus reads /etc/prometheus/prometheus.yml and writes blocks under /var/lib/prometheus:
sudo mkdir -p /etc/prometheus /var/lib/prometheusmkdir -p creates both paths in one step and does not complain if they already exist.
Download and install Prometheus binaries
Fetch the latest linux-amd64 release asset from GitHub into a fresh temporary directory so repeated runs do not pick up old tarballs under /tmp. The steps below use curl against the GitHub API; see the curl command for -fsSL and redirect options.
PROM_WORKDIR=$(mktemp -d)
cd "$PROM_WORKDIR"
PROM_URL=$(curl -fsSL https://api.github.com/repos/prometheus/prometheus/releases/latest \
  | grep browser_download_url \
  | grep linux-amd64.tar.gz \
  | cut -d '"' -f 4)
PROM_FILE=${PROM_URL##*/}
curl -fsSLO "$PROM_URL"
Extract that single archive and enter the directory it creates. The tar command covers -x extraction from .tar.gz files.
tar xf "$PROM_FILE"
cd "${PROM_FILE%.tar.gz}"
Copy the binaries and sample config from the extracted directory:
sudo cp prometheus promtool /usr/local/bin/
sudo cp prometheus.yml /etc/prometheus/
Prometheus 3.x tarballs include prometheus, promtool, and prometheus.yml only—the older consoles/ and console_libraries/ directories are gone, so the systemd unit below does not pass console paths.
Check the installed build:
prometheus --versionprometheus, version 3.14.0 (branch: HEAD, revision: d7598b7141418fa35be2b5ec5d0fefb634199610)
build user: root@f423027f4410
build date: 20260817-16:49:19
go version: go1.26.6
platform: linux/amd64The first line confirms the installed Prometheus version and architecture.
Set ownership and validate the config
Prometheus needs write access to /var/lib/prometheus for TSDB data. The config under /etc/prometheus must be readable by the prometheus user; the binaries in /usr/local/bin only need standard world-readable permissions. Apply ownership with chown command syntax:
sudo chown -R prometheus:prometheus /var/lib/prometheus
sudo chown -R root:prometheus /etc/prometheus
sudo chmod -R g+r /etc/prometheus
Validate syntax before you register systemd:
sudo -u prometheus promtool check config /etc/prometheus/prometheus.ymlChecking /etc/prometheus/prometheus.yml
SUCCESS: /etc/prometheus/prometheus.yml is valid prometheus config file syntaxA SUCCESS line means the YAML parses; it does not prove every scrape target is reachable yet.
The default file scrapes the Prometheus process itself on localhost:9090:
grep -A6 'job_name' /etc/prometheus/prometheus.yml - job_name: "prometheus"
static_configs:
- targets: ["localhost:9090"]That single job is enough for the lab; add node_exporter or application targets later in the same file.
This installation currently scrapes Prometheus itself. It does not yet collect host CPU, memory, filesystem, or network metrics. Those require a separate exporter such as Node Exporter and additional scrape jobs in prometheus.yml.
Create the Prometheus systemd unit
Create /etc/systemd/system/prometheus.service with a listener on all interfaces:
sudo tee /etc/systemd/system/prometheus.service >/dev/null <<'EOF'
[Unit]
Description=Prometheus
Documentation=https://prometheus.io/docs/introduction/overview/
Wants=network-online.target
After=network-online.target

[Service]
Type=simple
User=prometheus
Group=prometheus
ExecReload=/bin/kill -HUP $MAINPID
ExecStart=/usr/local/bin/prometheus \
  --config.file=/etc/prometheus/prometheus.yml \
  --storage.tsdb.path=/var/lib/prometheus \
  --web.listen-address=0.0.0.0:9090
SyslogIdentifier=prometheus
Restart=always

[Install]
WantedBy=multi-user.target
EOF
Reload systemd and start Prometheus. Service management in this guide uses systemctl command for daemon-reload, enable, and status checks:
sudo systemctl daemon-reloadEnable Prometheus at boot and start it now:
sudo systemctl enable --now prometheusConfirm the unit is active:
systemctl is-active prometheusactiveThe ready endpoint should answer once nothing else is bound to 9090:
curl -fsS http://127.0.0.1:9090/-/readyPrometheus Server is Ready.If you see bind: address already in use in journalctl -u prometheus, inspect port 9090—Cockpit is the usual culprit on RHEL hosts. Unit logs are covered in view logs using journalctl.
Install Grafana from the official RPM repository
Grafana publishes Enterprise Linux builds at rpm.grafana.com. The OSS grafana package installs grafana-server and listens on port 3000.
Add the Grafana repository
Write /etc/yum.repos.d/grafana.repo:
sudo tee /etc/yum.repos.d/grafana.repo >/dev/null <<'EOF'
[grafana]
name=grafana
baseurl=https://rpm.grafana.com
repo_gpgcheck=1
enabled=1
gpgcheck=1
gpgkey=https://rpm.grafana.com/gpg.key
sslverify=1
sslcacert=/etc/pki/tls/certs/ca-bundle.crt
EOF
Install the server package with dnf:
sudo dnf install -y grafanaConfirm the RPM version that landed on disk with rpm command metadata queries:
rpm -qi grafana | head -5Name : grafana
Version : 13.2.0
Release : 1
Architecture: x86_64
Install Date: Thu 20 Aug 2026 08:37:27 AM ISTThe post-install script reminds you to enable the service—it does not start Grafana automatically.
Start and verify Grafana
Enable and start grafana-server:
sudo systemctl enable --now grafana-serverPoll the health endpoint until Grafana answers—first boot can take longer while plugins initialize:
for i in $(seq 1 30); do
  curl -fsS http://127.0.0.1:3000/api/health && break
  sleep 1
done{
"database": "ok",
"version": "13.2.0",
"commit": "f681b1359f6a0b8ecb9f2c49a88ac72b75bde73b"
}Confirm the service stayed running:
systemctl is-active grafana-serveractive"database": "ok" in the health JSON means the embedded SQLite store opened cleanly.
Open firewall ports when firewalld is active
Skip this section when firewalld is inactive or you reach the hosts only over SSH port forwarding.
Check whether firewalld is running:
systemctl is-active firewalldactivePermanently allow Prometheus and Grafana, then reload:
sudo firewall-cmd --add-port=9090/tcp --permanentGrafana uses port 3000 for the web UI:
sudo firewall-cmd --add-port=3000/tcp --permanentReload firewalld so both permanent rules take effect immediately:
sudo firewall-cmd --reloadList open ports to confirm both entries:
sudo firewall-cmd --list-ports9090/tcp 3000/tcpSee the firewalld cheat sheet for zone-specific rules when your public zone is not the default.
Verify Prometheus in a browser
Prometheus serves its own UI on port 9090. Use it to confirm the TSDB is accepting queries before you wire Grafana.
- Open
http://SERVER:9090from a workstation that can reach the host (replaceSERVERwith the VM IP or hostname). - Open the Query tab if another view loads first.
- Type
upin the query box and click Execute. - Confirm a table row shows
job="prometheus",instance="localhost:9090", and value 1.
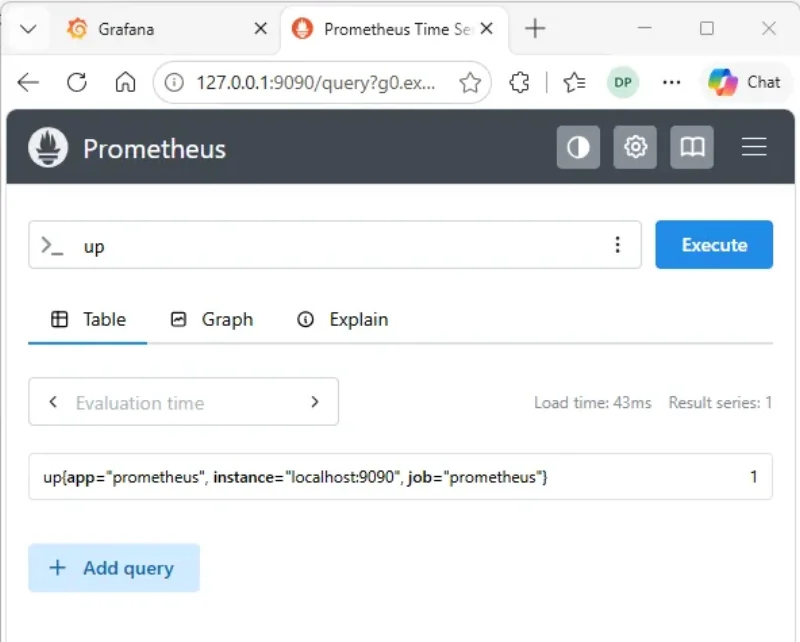
Value 1 means Prometheus is scraping itself successfully. Value 0 means the target is down—check systemctl status prometheus before you continue.
From the same host you can also request the build info API:
curl -fsS http://127.0.0.1:9090/api/v1/status/buildinfo | head -c 120{"status":"success","data":{"version":"3.14.0","revision":"d7598b7141418fa35be2b5ec5d0fefb634199610","branch":"HEAD"The JSON version field should match the tarball you installed.
Log in to Grafana
Grafana listens on port 3000. Sync the server clock first—Grafana compares browser time to VM time and warns when they drift by more than a few minutes.
- Open
http://SERVER:3000in a browser. - Sign in with username admin and password admin.
- Set a new password when Grafana prompts you on first login.
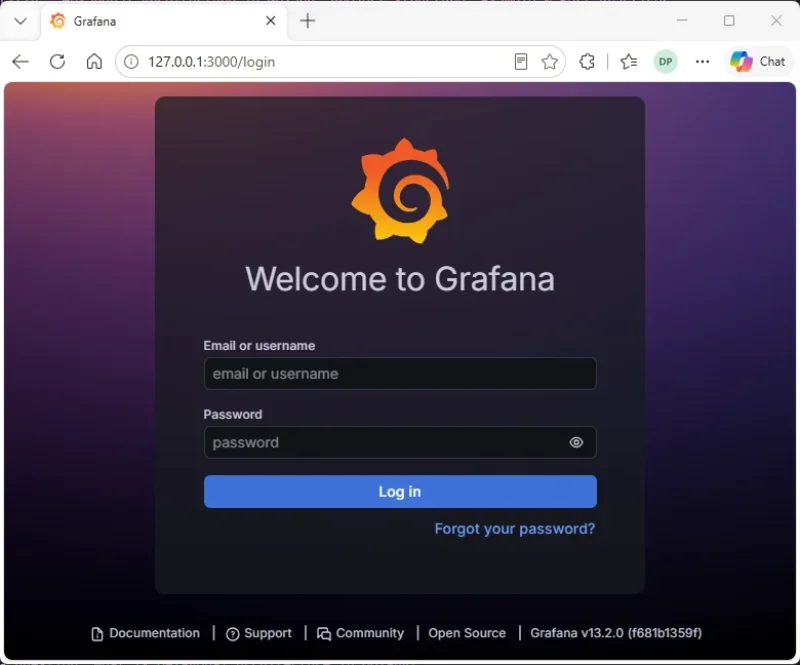
After login you land on the Grafana home page. The left menu gives access to Connections, Dashboards, and Explore.
Add Prometheus as a data source
Grafana needs a data source entry before it can query Prometheus metrics.
- Open the menu (☰) and go to Connections → Add new connection (or Connections → Data sources → Add new data source).
- Search for Prometheus and select it.
- Set URL to
http://localhost:9090because Grafana and Prometheus run on the same host in this guide. - Leave Access as Server (default) so Grafana queries Prometheus from the server side.
- Scroll down and click Save & test.
A green banner confirms Grafana reached the Prometheus API:

If Save & test fails, run systemctl is-active prometheus on the server and confirm curl http://127.0.0.1:9090/-/ready prints Prometheus Server is Ready.
Open Explore in the Grafana menu to run PromQL against the connected data source, or import community dashboards from Grafana.com when you want prebuilt graphs. Host CPU and memory dashboards typically need Node Exporter scraped on port 9100 in addition to the Prometheus self-scrape job above.
Update Prometheus and Grafana
Prometheus: use the same PROM_WORKDIR / PROM_FILE pattern from the install section—download a newer linux-amd64 tarball into a fresh mktemp -d directory, replace /usr/local/bin/prometheus and promtool, run promtool check config, then sudo systemctl restart prometheus. Read upstream release notes before jumping major versions.
Grafana: refresh metadata and upgrade the RPM:
sudo dnf upgrade grafanaRestart Grafana so the new binary is running:
sudo systemctl restart grafana-serverConfirm the Prometheus binary you just installed:
prometheus --versionConfirm the Grafana build that is answering on port 3000:
curl -fsS http://127.0.0.1:3000/api/health | grep versionUninstall Prometheus and Grafana
Stop both services before you remove files:
sudo systemctl disable --now grafana-server prometheusRemove Grafana with dnf and delete the repository file if you no longer need it:
sudo dnf remove -y grafanaDrop the Grafana repository file when you no longer plan to upgrade from rpm.grafana.com:
sudo rm -f /etc/yum.repos.d/grafana.repoDelete Prometheus binaries, unit file, and data when you do not need historical metrics:
sudo rm -f /usr/local/bin/prometheus /usr/local/bin/promtoolRemove the unit file so systemd cannot start Prometheus again:
sudo rm -f /etc/systemd/system/prometheus.serviceRemove configuration and TSDB data together:
sudo rm -rf /etc/prometheus /var/lib/prometheusDrop the service account once no files reference it:
sudo userdel prometheusRemove the now-empty prometheus group:
sudo groupdel prometheusReload systemd so it forgets the removed unit:
sudo systemctl daemon-reloadTroubleshooting
| Symptom | Likely cause | Fix |
|---|---|---|
bind: address already in use on port 9090 |
Cockpit or another service owns 9090 | Run ss -tlnp | grep 9090; stop cockpit.socket or change one service port |
prometheus.service fails immediately |
Config syntax error or wrong ownership | Run sudo -u prometheus promtool check config /etc/prometheus/prometheus.yml; fix chown on /etc/prometheus and /var/lib/prometheus |
Grafana dnf GPG error: signature is not alive |
System clock behind UTC | Run timedatectl; enable NTP and retry after System clock synchronized: yes |
| Grafana health check fails on first boot | Service still starting | Retry curl http://127.0.0.1:3000/api/health in a loop for up to 30 seconds |
Browser cannot reach :9090 or :3000 |
firewalld or cloud security group blocks ports |
Add 9090/tcp and 3000/tcp with firewall-cmd or your cloud console |
| Save & test fails in Grafana | Wrong URL or Prometheus down | Use http://localhost:9090 on a co-located install; confirm systemctl is-active prometheus |
| Grafana Server time is out of sync banner | VM clock behind laptop browser | Run timedatectl; enable NTP or set time manually, then hard-refresh the browser |
References
- Prometheus installation documentation
- Prometheus configuration
- Grafana installation on Red Hat, CentOS, Fedora, and SUSE
- Grafana data source: Prometheus
Summary
You installed Prometheus from the upstream Linux binary under a dedicated prometheus account, stored metrics in /var/lib/prometheus, and registered a systemd unit that listens on port 9090. Grafana came from the official OSS RPM, runs as grafana-server on port 3000, and queries the local Prometheus API once you add http://localhost:9090 as a data source.
The main RHEL-family gotchas are port 9090 (Cockpit uses it by default) and VM clock drift (Grafana warns when browser and server time disagree). This walkthrough scrapes Prometheus itself only—add Node Exporter or other targets when you need host or application metrics beyond the default up check.
For production, put TLS and authentication in front of both UIs instead of exposing plain HTTP on LAN-wide firewall rules. On Debian or Ubuntu, follow the Install Grafana on Ubuntu guide for apt repository steps.
Frequently Asked Questions
Does Cockpit conflict with Prometheus on RHEL?
Yes. Cockpit listens on TCP 9090 by default on RHEL and many rebuilds, which is the same port Prometheus uses. Check with ss -tlnp | grep 9090 before you start Prometheus. Stop or disable cockpit.socket, move Cockpit to another port, or run Prometheus on a different listen address if you need both services on one host.
How do I install Grafana on Rocky Linux or AlmaLinux?
Add the official Grafana OSS RPM repository at rpm.grafana.com, run sudo dnf install grafana, then sudo systemctl enable --now grafana-server. Grafana listens on port 3000. Log in with admin and admin on first access and set a new password.
Why does dnf fail with a Grafana GPG signature is not alive error?
The Grafana repository metadata is signed with a Valid-From timestamp. If the system clock is behind real time, dnf rejects the signature. Run timedatectl, enable NTP with sudo timedatectl set-ntp true or chronyc makestep, confirm System clock synchronized is yes, then retry dnf install grafana.
Where does Prometheus store metrics on Linux?
In this guide Prometheus writes TSDB blocks under /var/lib/prometheus because the systemd unit passes --storage.tsdb.path=/var/lib/prometheus. Configuration lives in /etc/prometheus/prometheus.yml. Back up that directory before major upgrades or uninstall steps.
Can I use this guide on Debian or Ubuntu?
Prometheus steps are similar on any Linux host, but package names, firewall tools, and Grafana repository layout differ on Debian family systems. Use the Install Grafana on Ubuntu guide on this site for apt-based Grafana setup.
How do I uninstall Prometheus and Grafana?
Stop and disable both systemd units, remove /etc/systemd/system/prometheus.service and /usr/local/bin/prometheus and promtool, delete /etc/prometheus and /var/lib/prometheus when you no longer need data, run sudo dnf remove grafana for the RPM, and remove /etc/yum.repos.d/grafana.repo if you added the Grafana repository.